New UTXO Charts for Analyzing UTXO Activity
We're excited to introduce 3 new UTXO charts! These three charts provide additional depth to UTXO activity on the Kaspa network.
Posted: Mar 26, 2024
By: Kaspalytics
We are pleased to announce three new UTXO charts! These three new charts provide depth to UTXO activity on the Kaspa network, beyond what our existing UTXO Count chart could provide in isolation.
Without further ado, the three new charts are:
- Count of UTXOs Created chart
- Count of UTXOs Spent chart
- UTXO Count Net Change chart
These charts are pretty straightforward. Let’s still do a quick overview of each!
1.) UTXOs Created Chart
Starting with… the UTXOs Created chart! This chart simply tracks the count of UTXOs created daily.
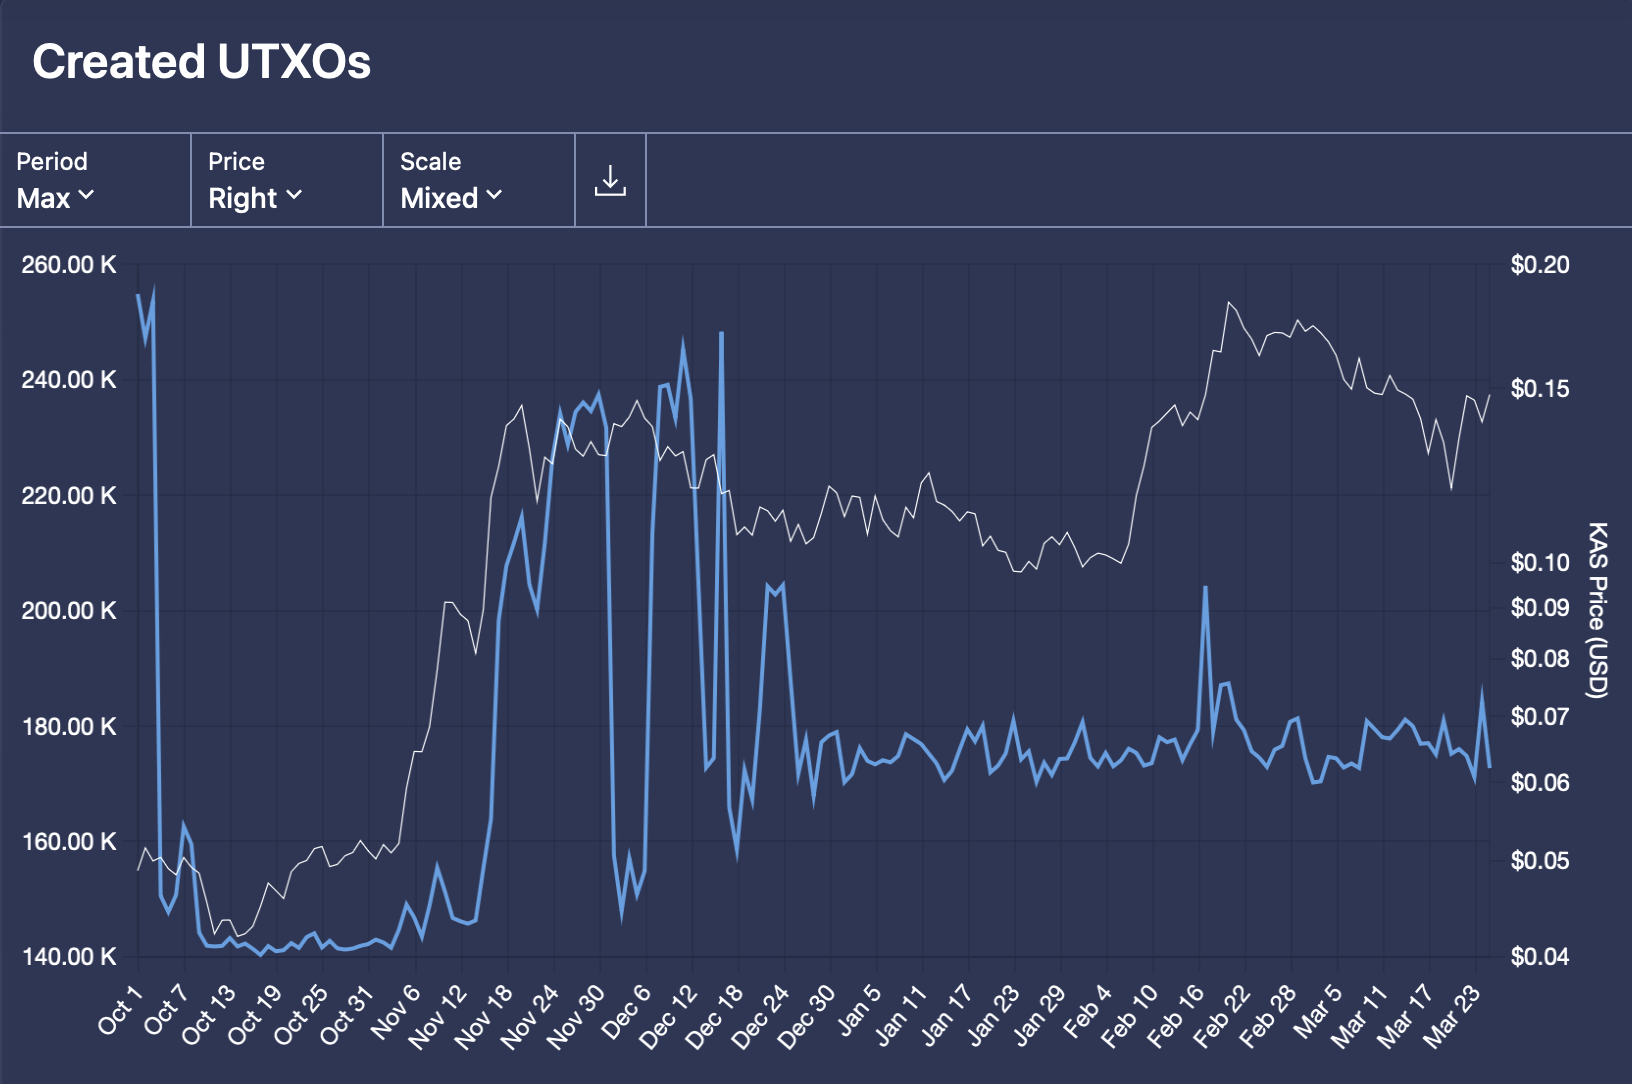 Kaspa UTXOs Created Chart.
Each transaction on the Kaspa network creates UTXOs, including Coinbase transactions. The data for this chart is calculated by looking at each accepted transaction for the given day. For each accepted transaction, we count the number of UTXOs created and add that to the total for the day.
The only time period supported at the moment is daily. At some point in the future we will add weekly and monthly totals.
2.) UTXOs Spent Chart
The UTXOs Spent chart simply tracks the count of UTXOs spent.
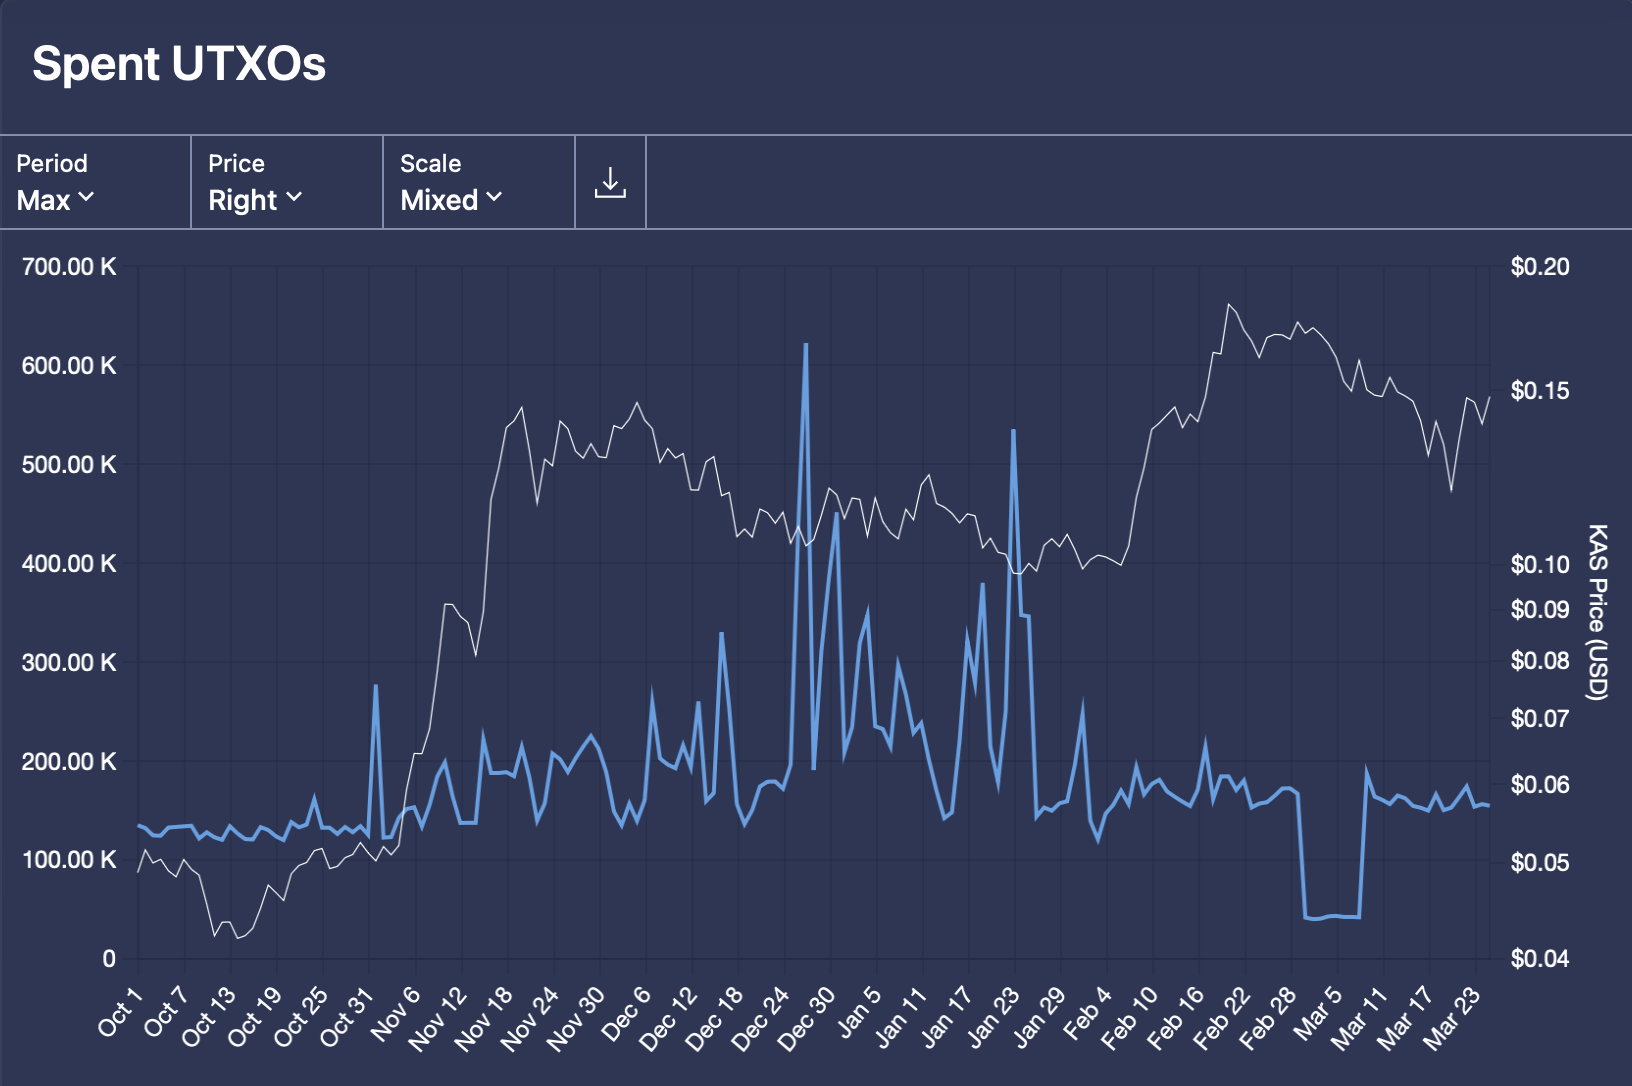 Kaspa UTXOs Spent Chart.
Regular (non-coinbase) transactions have inputs. An input is a reference to a UTXO. When a spender successfully unlocks a UTXO, the UTXO can be “spent” as a transaction input and is removed from the UTXO set. This is how KAS is sent on the network.
Tracking the count of UTXOs spent is relatively easy. All one needs is a list of accepted transactions. For each accepted transaction, we count the number of transaction inputs, and add that to the total for the day.
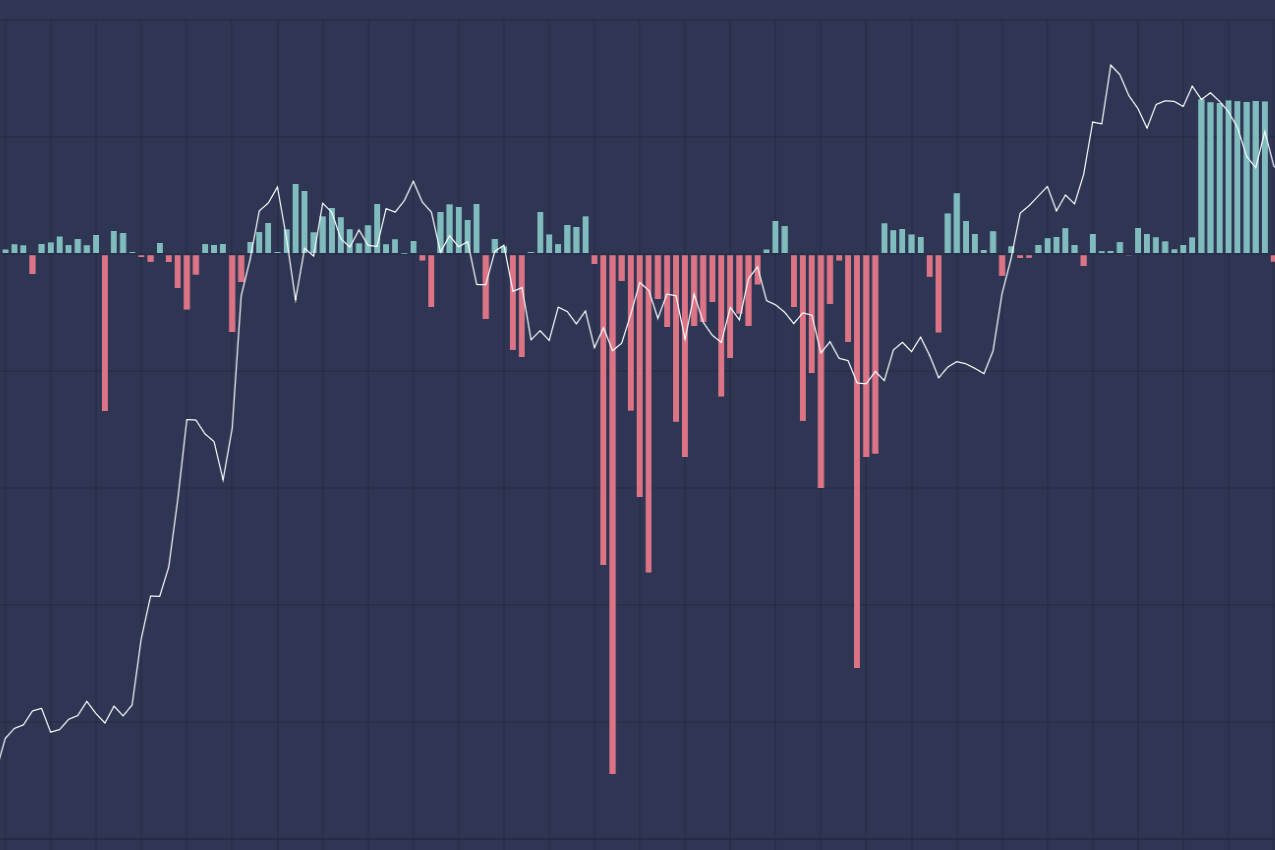
3.) UTXO Net Change Chart
The UTXO Net Change chart shows the change in UTXO count for the given day.
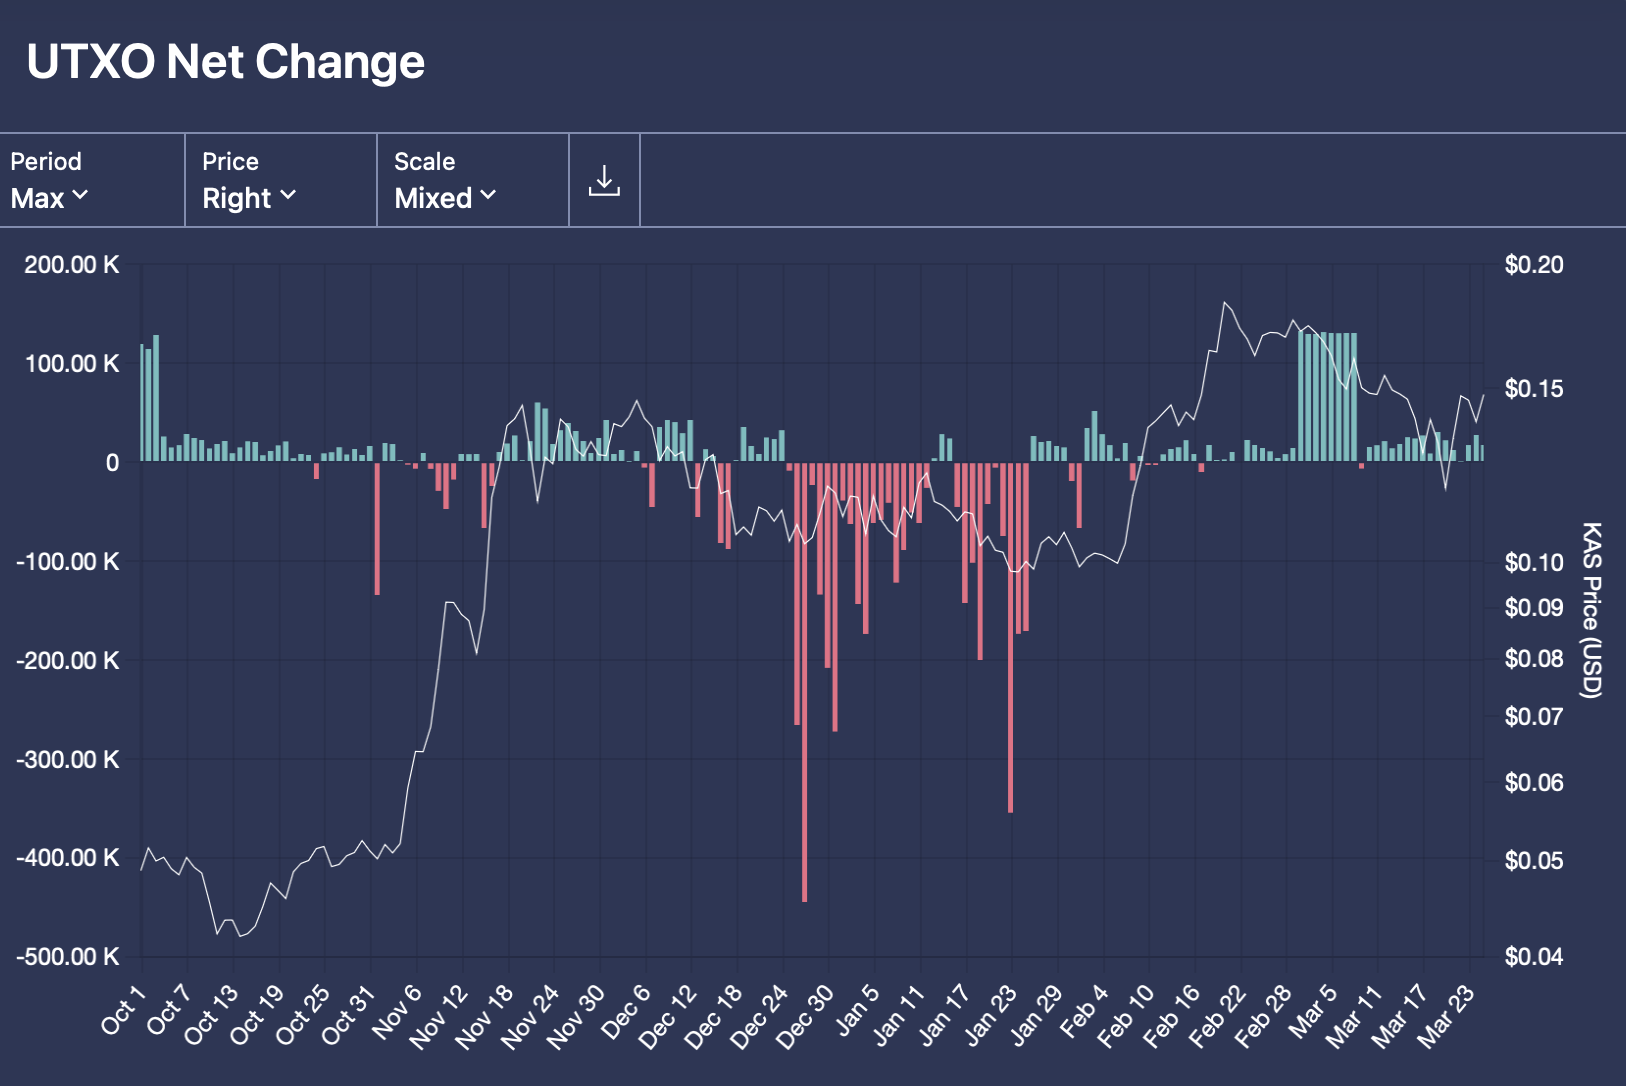 Kaspa UTXO Net Change Chart.
Put simply, it’s the result of the following:
Count of UTXOs Created - Count of UTXOs Spent = UTXO Net Change
Let’s take a quick example:
- 100,000 UTXOs are created today
- 95,000 UTXOs are spent today
- 100,000 created UTXOs - 95,000 spent UTXOs = a net increase of 5,000 UTXOs
The net change can be positive or negative. This information could already be deduced from the UTXO Count chart. However, viewing on its own chart does have some benefits.
Currently, the only supported period for these charts is daily. Though we do plan to add weekly and monthly in the future.
Thanks for reading!